ERS-1/TOPEX/POSEIDON Crossover Height Differences
Since TOPEX/POSEIDON (T/P) flies in a high-altitude orbit (1335 km) and has
three tracking systems to rely on for orbit determination (SLR, DORIS,
GPS), the long-term stability of the inferred sea level heights are likely
to be more precise than for ERS-1, which flies in a low-altitude orbit (785
km) and limps on one tracking system: SLR. Even though altimeter ranges and
crossover data are included in the orbit determination at DUT and UT/CSR,
we face a 5 cm radial orbit precision, compared to approximately 2 cm for
T/P.
To study the long-term stability of the ERS-1 orbits we have generated
dual-satellite crossover height differences between ERS-1 and
T/P. Data are based on the CERSAT and AVISO CD ROMs, with the
following enhancements:
- TOPEX and POSEIDON have been harmonised. The TOPEX oscillator drift and
internal calibration values are applied. Both data sets are corrected with
the DORIS Ionosphere because of its smoother character and availability for
both altimeters. The TOPEX ranges are corrected for a 1.5 cm bias.
- ERS-1 altimeter ranges are corrected for a 40.93 cm range bias, USO
clock drift and SPTR corrections.
- The Grenoble FES95.2.1 ocean tide model is applied for ERS-1 and
T/P data. Pole tide is correctly applied for all data sets.
- The Microwave radiometers provide the wet tropospheric correction.
- 100% Inverse barometer corrections are applied.
- The latest BM4 sea state bias models are applied to T/P,
ERS-1 is corrected for 5.5% SWH.
- ERS-1 data are alternatively referenced to the DUT and UT/CSR orbits.
Global statistics
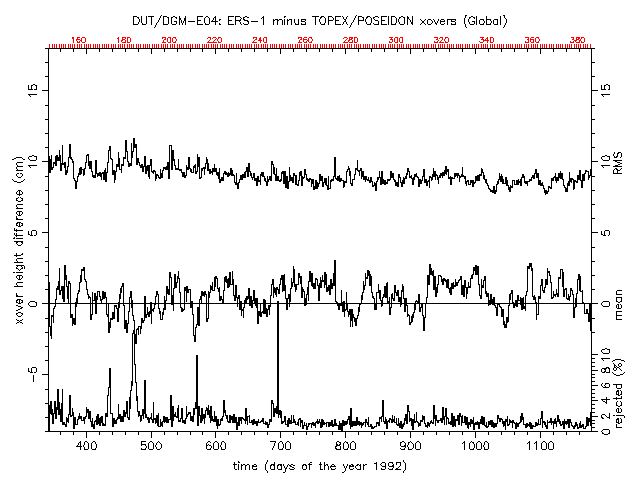
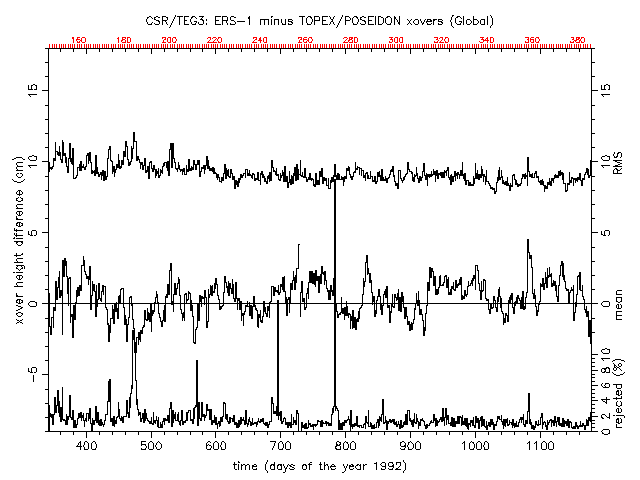
The plots below represent the global statistics of ERS-1 minus T/P sea
surface heights at crossover points. A maximum time interval of 5 days is
allowed, which is the longest time interval between any ERS-1 track and the
time-wise closest T/P track. Areas with high variability or known tide
model errors (some inner seas) are excluded. The lines in the plots are
(from top to bottom): rms and mean crossover height difference in daily
bins (ERS-1 time tags) and the percentage of rejected crossovers based on a
3.5% rejection criterion. The top plot is based on the DUT orbits, the
bottom with UT/CSR orbits. The period covers December 1992 till March 1995).


Click here for Postscript versions of the
DUT or
UT/CSR
plots, or tabulated versions of
DUT or
UT/CSR
statistics.
--------- Input --------- --------- Edited --------
     nr  mean   rms   std      nr  mean   rms   std  Orbit
1047934    .5  11.3  11.3 1041313    .5   9.0   9.0  DUT/DGM-E04
1043630    .7  28.8  28.8 1037020    .4   9.2   9.2  CSR/TEG3
Note that the DUT orbits have a slightly lower overall rms and that in both
cases the rms decreases towards the end of the period owing to decreasing
solar activity. The variation of the mean height difference are very
similar for both orbit solutions. When a smoothing is applied, the variance
is less than 1 centimetre, and obviously relates to anything else
than orbit error (variations of altimeter corrections, bias, etc.)
Southern latitudes
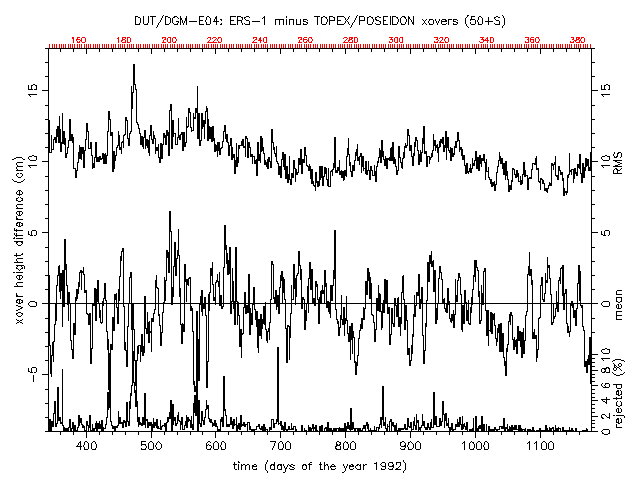
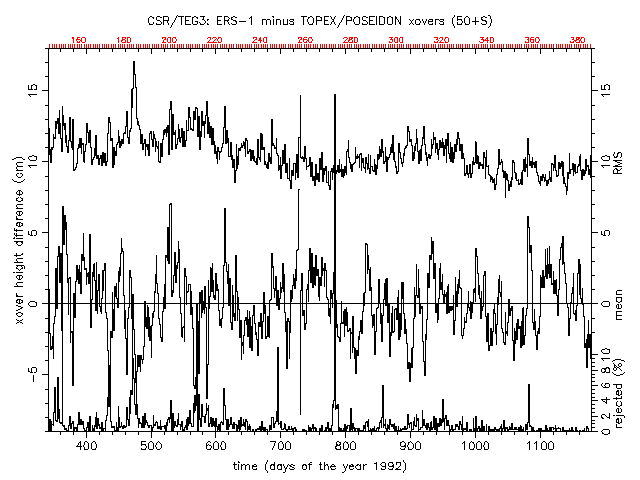
More relevant to the Antarctic mass-balance, will be the stability of the
orbits at Southern latitudes. Since TOPEX extends no further South than 66
degrees, we selected crossovers in a strip between 50 and 66 South and made
the same plots as above.


Click here for Postscript versions of the
DUT or
UT/CSR
plots, or tabulated versions of
DUT or
UT/CSR
statistics.
--------- Input ---------  -------- Edited --------
     nr  mean   rms   std      nr  mean   rms   std  Orbit
 431737   -.4  11.1  11.1  430281   -.4  10.4  10.4  DUT/DGM-E04
 429840    .5  40.4  40.3  428209    .0  10.6  10.6  CSR/TEG3
The rms height difference shows a yearly cycle, which may be contributed to
the yearly cycle in the abundance of sea ice in the late Arctic Winter
(August). The variation of the mean is larger because of the limited amount
of data used to created these plots, but remains small after smoothing.
After taking the running average over 10 days the variation is still below
1 centimetre, and follow the same pattern as the global plots. This
suggests that the height differences are instument or correction related,
rather than orbit related. This suggestion is supported by the fact that
the results with the two orbits follow the same pattern within a few
millimetres.
DUT orbits show a few less spikes in the mean and rms statistics. The
overall rms is again 2 millimeters lower.
Conclusions
Judging from ERS-1 versus T/P crossover height differences, it is evident
that the choice of orbit will not influence the variations seen in the
Antarctic mass balance. The sea height differences measured by ERS-1 and T/P
vary by about 1 centimetre, depending on the type of smoothing chosen. The
choice of the orbit solution has an almost negligible effect on the
relative sea height variations, which are themselves about five times
bigger, and are more likely due to altimeter corrections or the instruments
themselves.
Most importantly, the choice of the orbit appears not to be crucial. At the
current state-of-the-art, DUT and CSR provide the best possible orbits,
with differences yet beyond our apprehension.
More analyses on ERS-1
orbit stability
 Questions or comments:
Remko Scharroo, remko.scharroo@lr.tudelft.nl.
6 March 1997.


 Questions or comments:
Remko Scharroo, remko.scharroo@lr.tudelft.nl.
6 March 1997.