Annual Cycle in ERS-1 Sea Level
When studying ERS-1/TOPEX/POSEIDON crossover height
differences and cross-comparing directly
the DUT/DGM-E04 and CSR/TEG3 orbits for ERS-1 there was a suggestion of an
annual cycle. Here we have tried to see whether this cycle is of relevance
to the development of grids of the annual cycle in sea level, in the
anticipation that these results equally apply over the Antarctic.
ERS-1 Annual Cycle in Sea Level
The four plots below show the annual cycle in ERS-1 sea level based on
altimeter data for Mission Phases C, E, and F. The 3-day repeat of Phase D
is disregarded because of its low resolution. The sea level variation was
computed in crossover locations, where an average of one measurement per
17.5 days is available to estimate the mean, annual and semi-annual cycle.
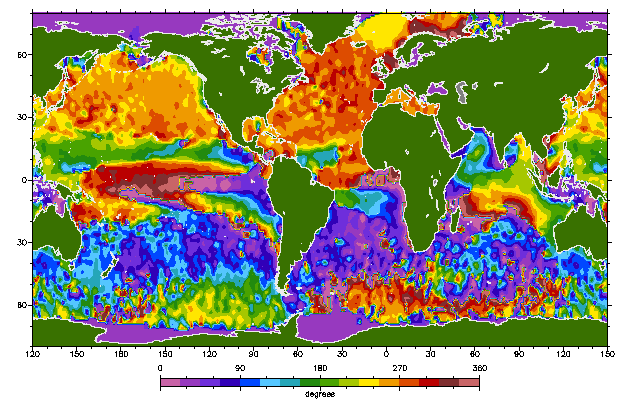
Displayed below is the amplitude and phase of the annual cycle computed with CSR
(amplitude RMS = 51 mm) and DUT orbits (amplitude RMS = 49 mm). The
differences in amplitude are almost invisible, but a shift of phase in the
Northern North Atlantic and South Pacific of about 1 month is visible.
ERS-1 Annual Amplitude in Sea Level: CSR Orbits

ERS-1 Annual Amplitude in Sea Level: DUT Orbits

ERS-1 Annual Phase in Sea Level: CSR Orbits

ERS-1 Annual Phase in Sea Level: DUT Orbits

In order to better visualise the effect of the selection of the orbits, we
have computed the RSS difference between the In-Phase and Quadrature annual
amplitudes of the two solutions for the annual sea level variation and
found only significant differences in three areas: The Mid Southern
Pacific, North West Pacific and Northern North Atlantic (see plot below).
The differences appear also mainly in the In-Phase term with its maximum on
1 January (not shown).
The larger differences around the Antarctic ice margin are insignificant.
The total weighted RMS difference is 8 mm. (Note the change of scale with
respect to the previous plots of the actual annual cycle.)
Annual Amplitude Difference Between CSR and DUT Orbits

It is not clear to which orbit most of the annual cycle differences has to
be attributed.
ERS-1 and TOPEX/POSEIDON Annual Cycle in Sea Level
An independent assessment of which orbit is to blame for the difference in
the computed annual cycle is possible by differencing the ERS-1 derived annual
cycle with the TOPEX/POSEIDON derived annual cycle. However, in order to
prevent problems with sampling, I choose to determine an annual cycle in
crossover height differences between ERS-1 and T/P (maximum time interval:
5 days). This actually worked quite well and resulted in again two plots of
annual cycle differences, one determined with CSR and one with DUT orbits
for ERS-1. The weighted RMS differences are 17 and 16 mm, respectively,
which is twice as much as the differences between the two orbit solutions.
ERS-1/TP Annual Amplitude in Sea Level Difference: CSR Orbits

ERS-1/TP Annual Amplitude in Sea Level Difference: DUT Orbits

It appears that where the difference between the orbits was the most
dominant (Southern and North West Pacific) it is the DUT orbits that give
the least differences with the TOPEX/POSEIDON data. (Note that ERS-1/TP
crossovers were not used in the DUT orbit determination.) Near
Greenland it is the CSR orbits that show the least discrepancy between
ERS-1 and T/P.
Conclusions
From this we can conclude that there is a clear annual cycle in the
difference between the CSR and DUT orbits, globally at the level of 8 mm.
However, with respect to the annual cycle itself (50 mm) this appears quite
insignificant. Even the annual cycle seen in ERS-1 sea height differences
with TOPEX/POSEIDON are twice as large (16 mm).
If any preferential behaviour could be noticed, it is with the DUT orbits
because they depict the least difference in annual cycle when comparing
ERS-1 with TOPEX/POSEIDON. But my opinion may be biased :-)
More analyses on ERS-1
orbit stability
 Questions or comments:
Remko Scharroo, remko.scharroo@lr.tudelft.nl.
8 October 1997.


 Questions or comments:
Remko Scharroo, remko.scharroo@lr.tudelft.nl.
8 October 1997.